Visualizing Sound
(Peterson Field Guide to Bird Sounds, interactive version of pp. 6-7)
Visualizing bird sounds makes it easier to identify them, because the aspects of bird sound that are important for visualization are the same ones that are important for identification: pitch pattern, speed, repetition, pauses, and tone quality. Creating a mental image of the sound makes it possible to look up the sound in the visual index of the book (p. 495), where similar sounds are grouped by their visual pattern.
How to see it
The best way of depicting bird sounds visually is the spectrogram (often called the Sonagram), a computer-generated graph of sound frequencies across time. Below, compare how the same familiar tune appears in two different visual depictions: standard musical notation on the left, and a spectrogram on the right:
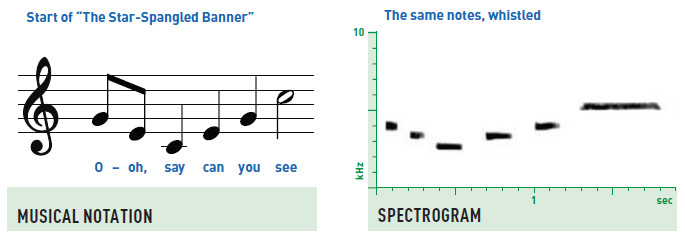
Musical notation places notes on a staff, while spectrograms measure the frequency of sounds in kilohertz (kHz), but the basic principle is the same: they both read from left to right, with high notes near the top of the chart and low notes near the bottom. On a spectrogram, the more horizontal space a note takes up, the longer it lasts in time.
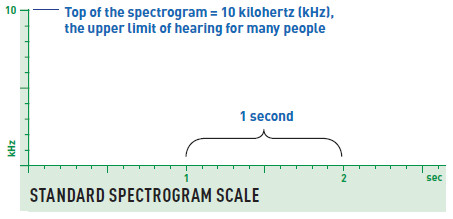
Most spectrograms in the Peterson Field Guide to Bird Sounds conform to the scale above, with the top of the spectrogram at 10 kHz (near the upper limit of hearing in most adults) and numbers across the bottom marking intervals of one second.
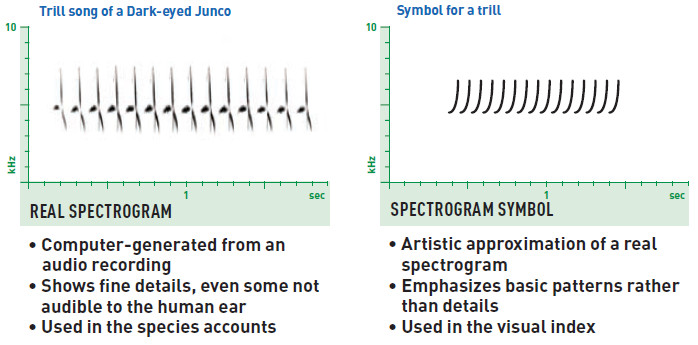
Real spectrograms vs. spectrogram symbols
The Peterson Field Guide to Bird Sounds uses two types of visualizations: real spectrograms in the species accounts,
where accuracy and detail are important; and spectrogram symbols in the visual index, where basic patterns and similarities are more important than detail.
The five basic pitch patterns
Unlike music, bird sound identification does not require attention to the precise pitch of notes; more important is how the pitch changes. All bird sounds can be described with just five basic pitch patterns (or combinations thereof), which can be visualized this way:
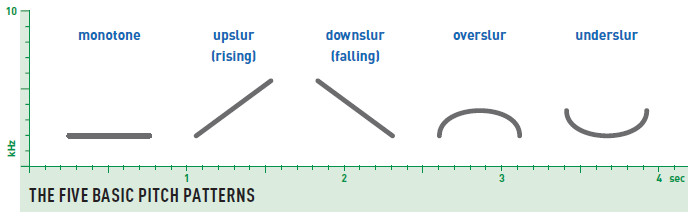
- Monotone sounds do not change in pitch, and appear horizontal on the spectrogram.
- Upslurred sounds rise in pitch, and appear tilted upward.
- Downslurred sounds fall in pitch, and appear tilted downward.
- Overslurred sounds rise and then fall in pitch, appearing and sounding highest in the middle.
- Underslurred sounds fall and then rise, appearing and sounding lowest in the middle.
(Next: pp. 8-9: The four basic patterns of repetition and speed)